Technical analysis is a method of forecasting price movements in financial markets based on the study of historical market data, primarily prices and volumes. Unlike fundamental analysis, which focuses on valuing an asset’s intrinsic worth, technical analysis concentrates on market activity statistics.
The core principle of technical analysis is that price fluctuations are not random.
Technical analysis is based on three primary assumptions:
- The Market Discounts Everything: Technical analysis presumes that the current price of an asset already reflects all available and known data. This means every event—from economic indicators to political incidents—is already factored into the asset’s price.
- Prices Move in Trends: Technical analysis assumes prices typically move in certain trends. An asset’s price tends to move in one direction for a set period before changing direction.
- History Repeats Itself: Technical analysis also operates on the premise that patterns in market behavior repeat over time. This means specific price behavior patterns observed in the past are likely to recur in the future. The key is to identify them correctly.
Technical Analysis Tools
Technical analysis employs a variety of tools to analyze price movements and determine potential trends. These tools include:
- Price Charts: The most crucial instrument in technical analysis, price charts allow traders to visualize price movements and identify different patterns.
- Technical Indicators: These are algorithms or calculations based on historical price, volume, or open interest information that aim to help forecast financial market directions. Some of the notable examples are the Relative Strength Index (RSI) and the Moving Average Convergence/Divergence (MACD).

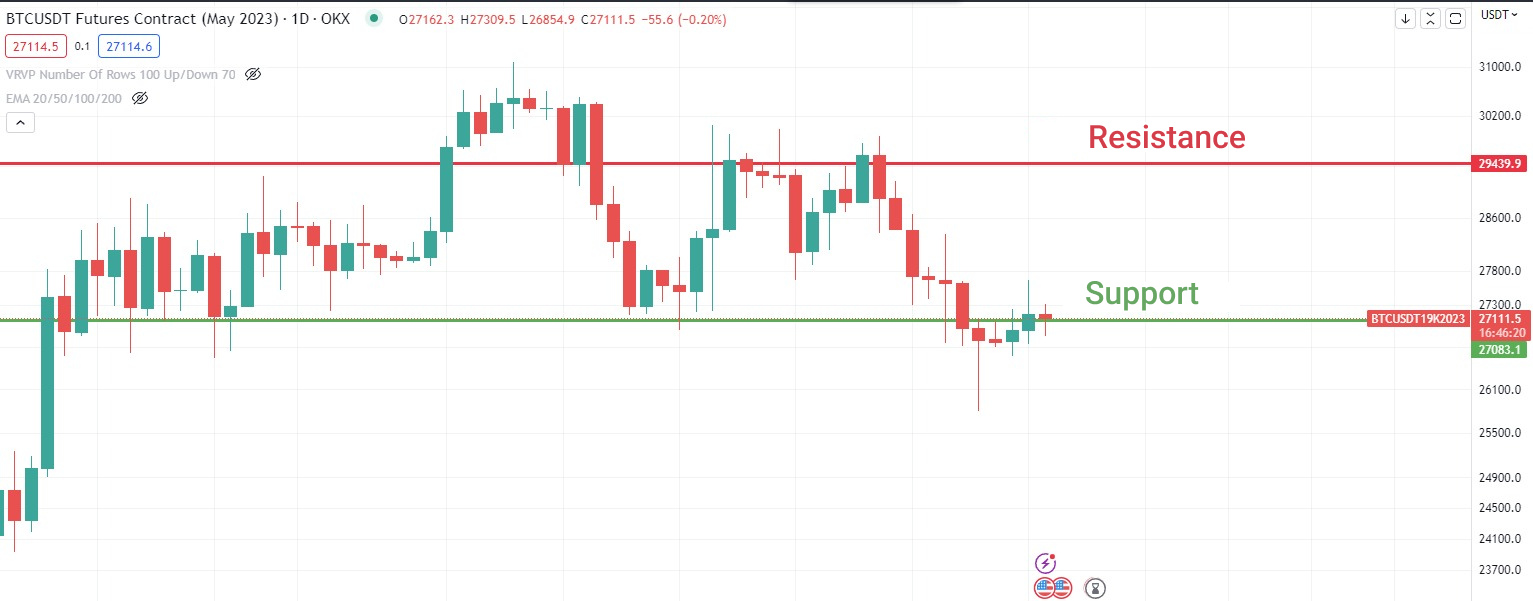
- Support and Resistance Levels: At its core, support is a price level where a downtrend can be expected to pause due to a concentration of demand. Similarly, resistance is a price level where an uptrend can be expected to pause due to a concentration of supply. These levels are not just points where prices change direction. They serve as crucial markers for traders to set entry and exit points, or stop-loss levels. Understanding them helps traders make better predictions about price movement. Additionally, it’s key to note that once these levels are broken, they can reverse roles; a resistance can become support and vice versa.
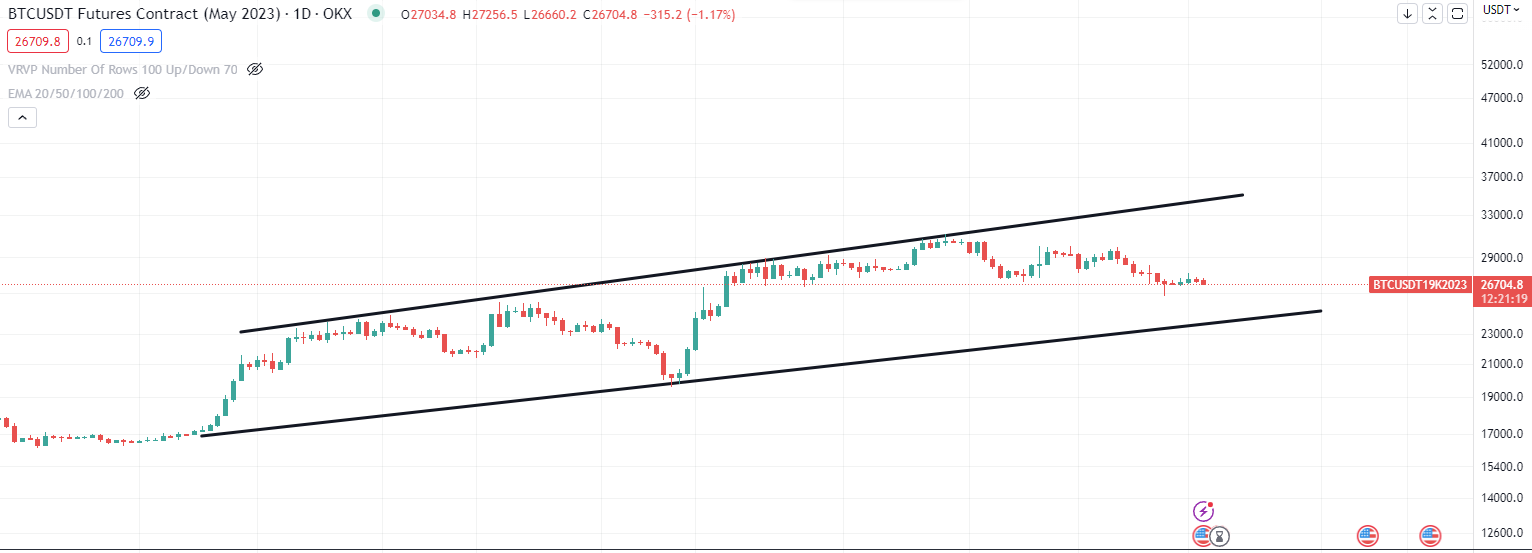
- Trend Lines: Trend lines assist traders in determining the overall direction of price movements. An ascending trend line connects low points in an upward trend, whereas a descending trend line links high points in a downward trend.
Types of Charts in Technical Analysis
There are several primary chart types utilized in technical analysis.
Line Charts
These are the simplest charts that display the closing price of an asset over a specified time period.

Bar Charts
These depict the opening, closing, highest, and lowest prices for a particular time span.
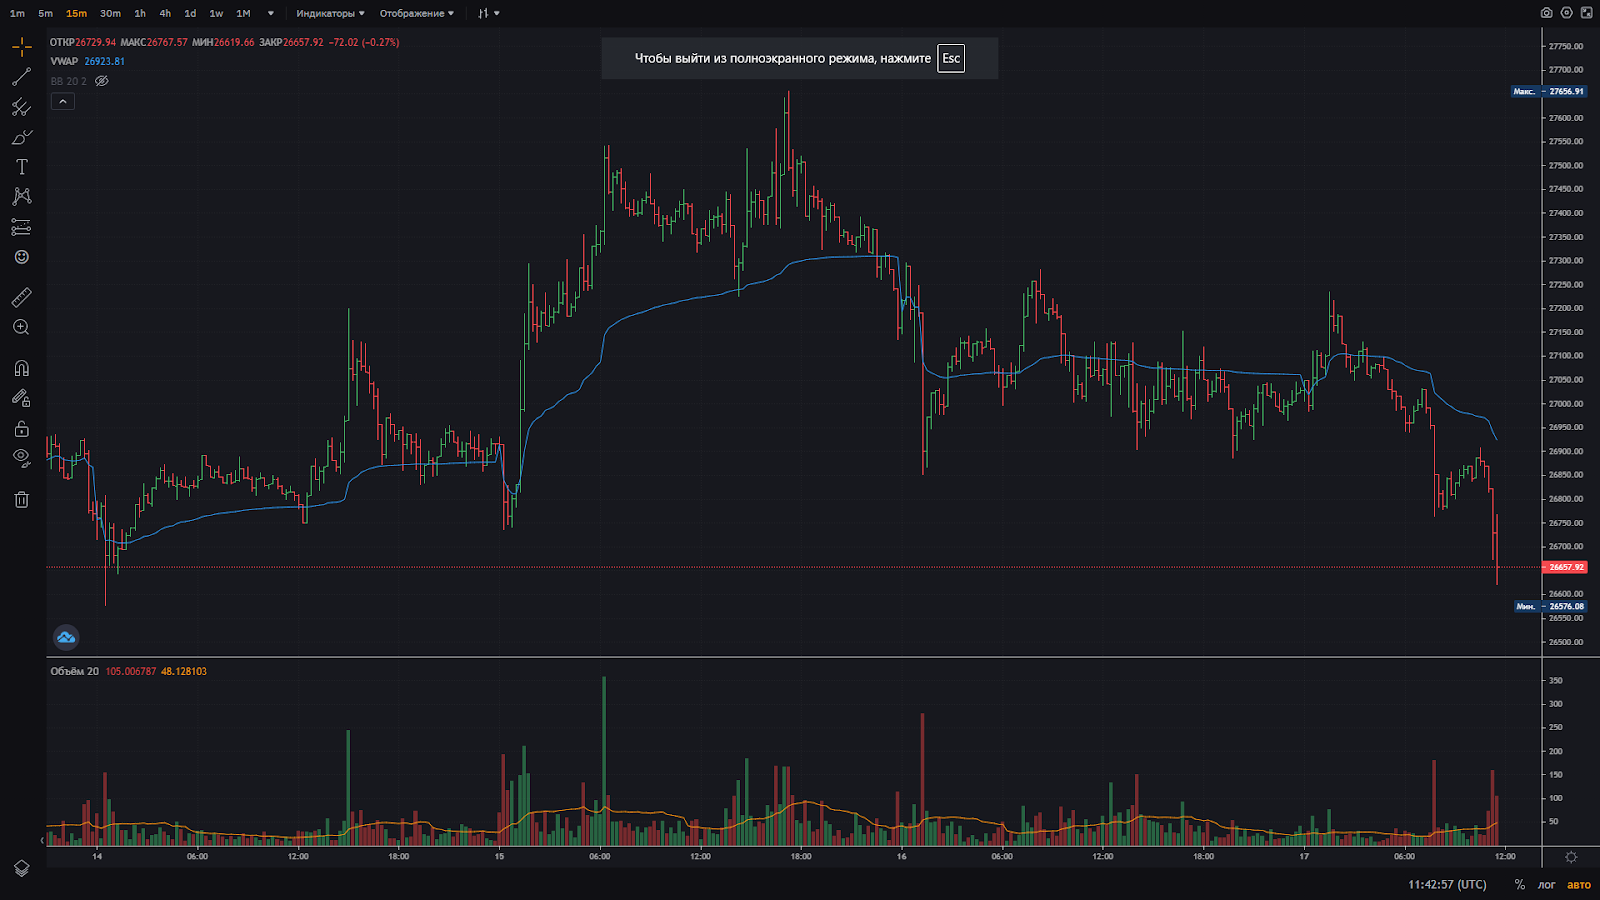
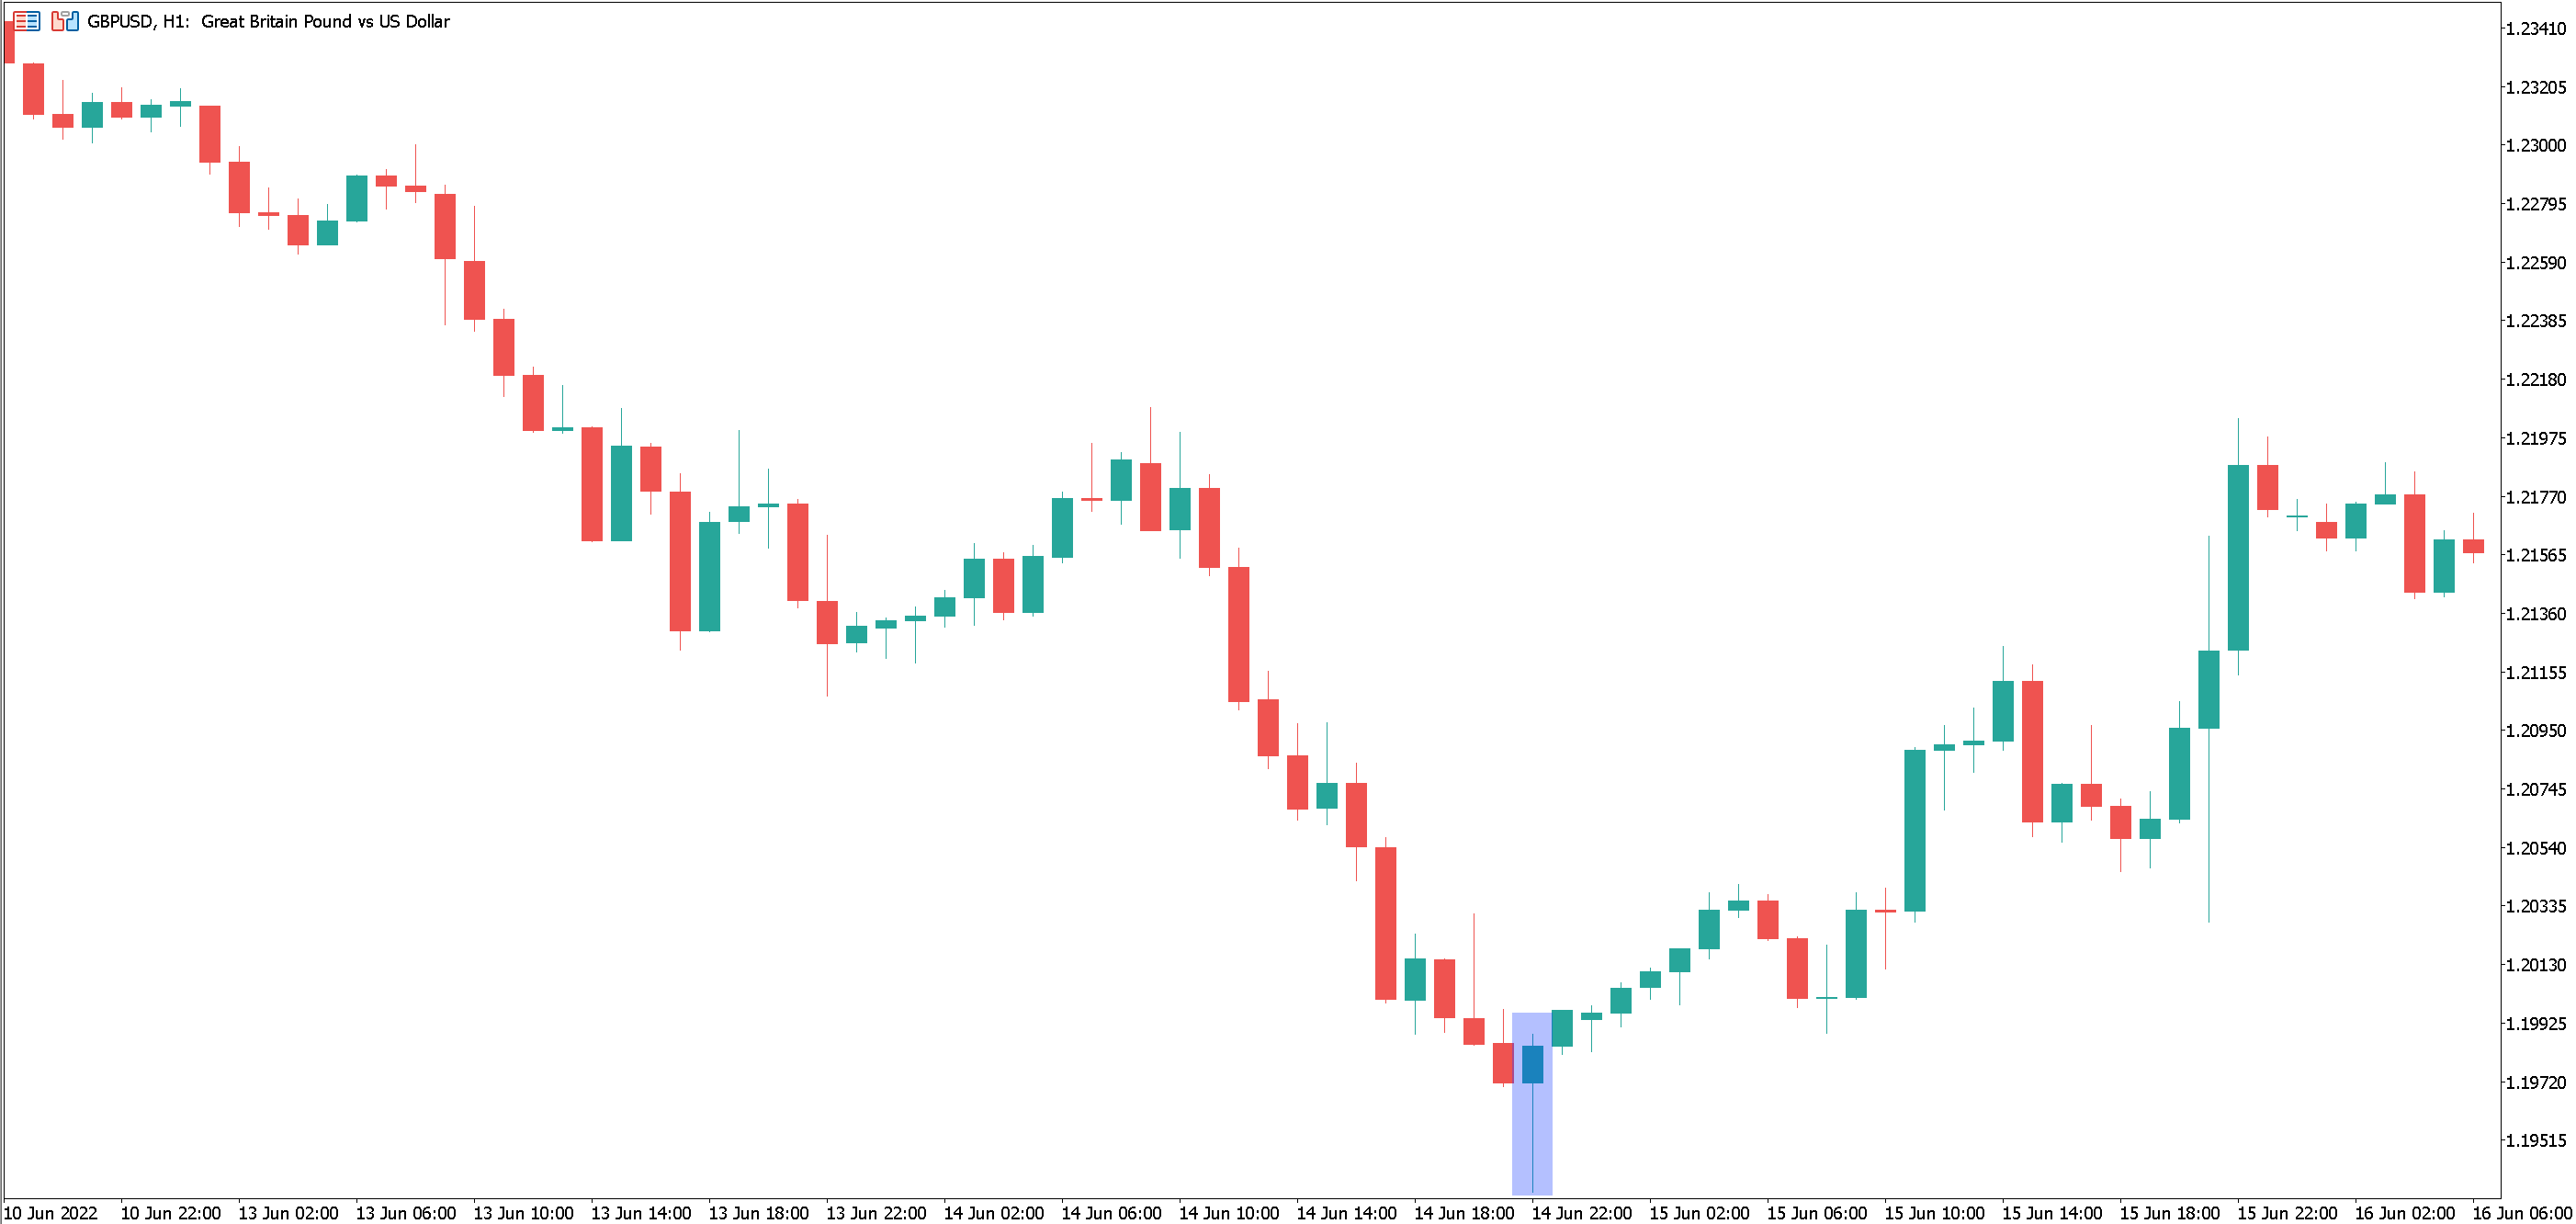
Japanese Candlesticks
Japanese candlestick charts resemble bar charts but convey information more visually. The body of the candlestick represents the difference between the opening and closing prices, while the “shadows” of the candlestick display the highest and lowest prices.
Examples of Technical Analysis
Trend Analysis
Trend analysis helps traders identify the direction an asset’s price is heading. Using tools like trend lines and indicators, such as moving averages (MA), they can better understand and anticipate price patterns.
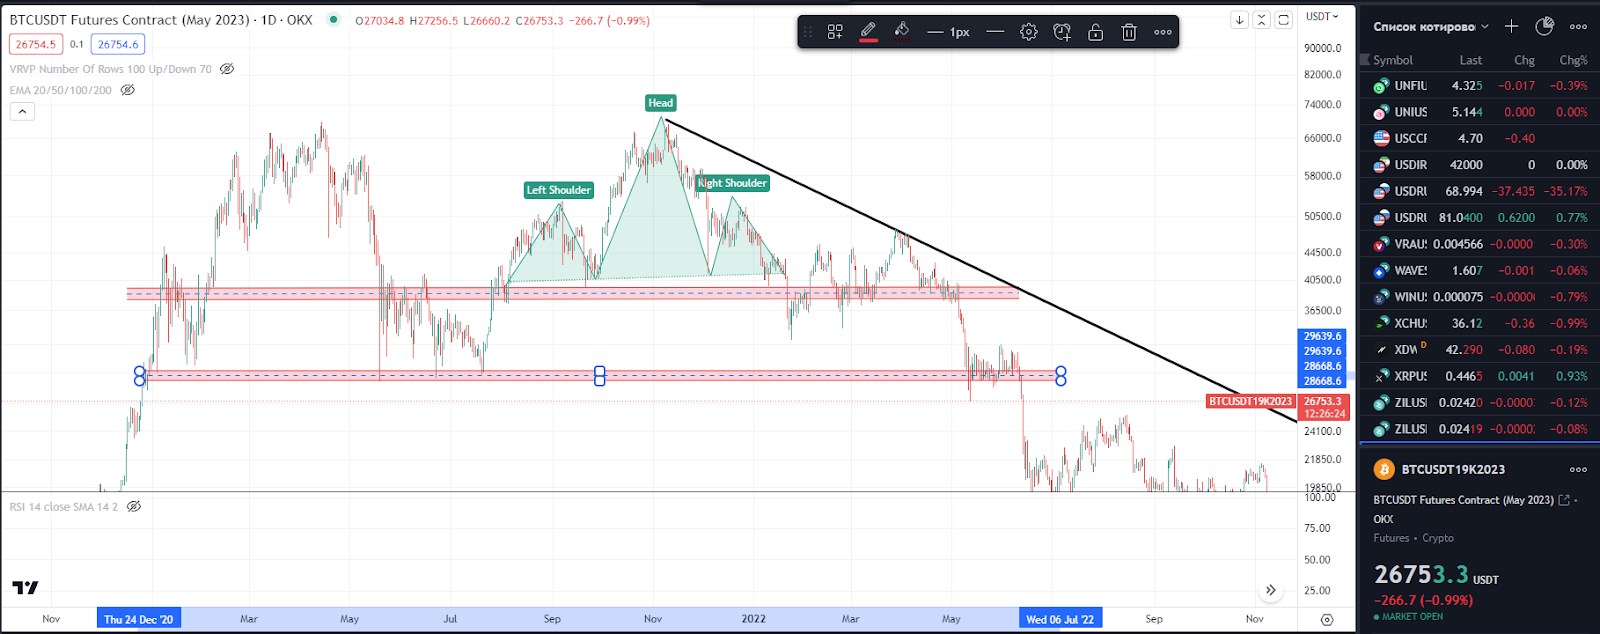
Pattern Analysis
These are specific shapes that emerge on price charts and may signal potential future price movements. Examples of such patterns include “head and shoulders,” “double bottom,” and “flag.”

Indicator Analysis
Indicators such as the Relative Strength Index (RSI), Moving Average Convergence/Divergence (MACD), or others can assist traders in determining whether an asset is overbought or oversold.
Technical analysis is a method allowing traders to forecast potential future price movements based on past price and volume data. However, despite its efficacy, technical analysis isn’t 100% accurate, and its predictions should be approached with caution. Successful application of technical analysis demands practice, thorough study, and market condition knowledge. Traders are advised to use it in conjunction with other analysis methods and consider their individual goals and risk appetite.