Support and resistance levels are crucial tools in technical analysis for trading. They help predict asset price movements in financial markets.
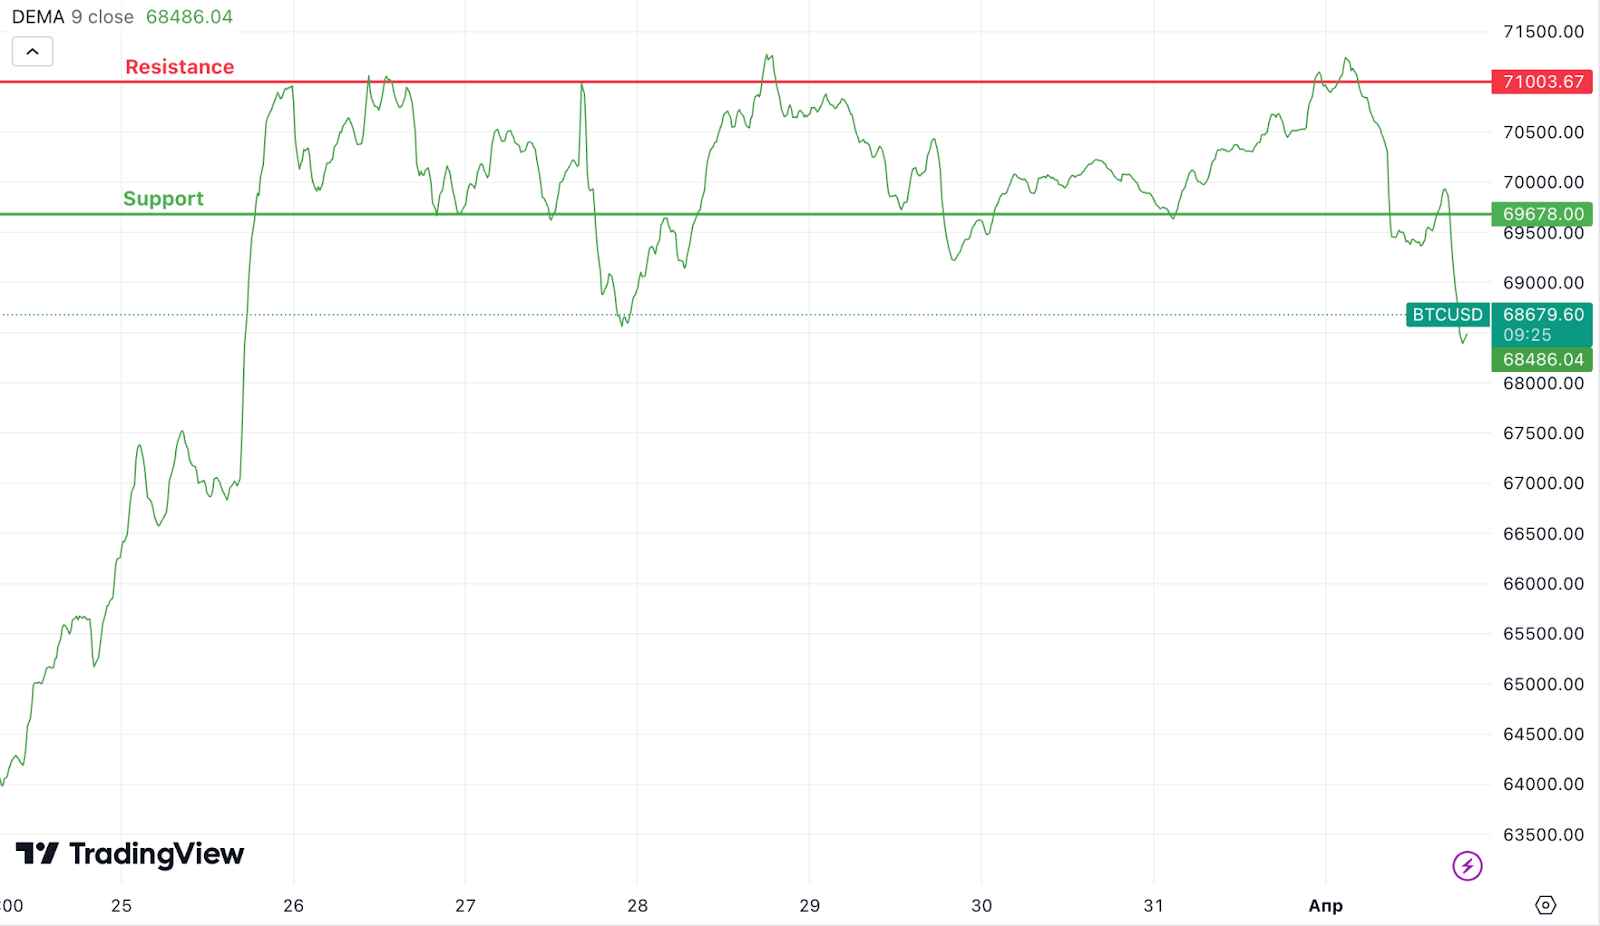
- Support Level: A price level below which the price of an asset rarely falls due to a large number of buyers. When an asset reaches this level, increased demand often prevents further price decline. A support level can be visualized as a floor that the price rests on.
- Resistance Level: A price level above which the price of an asset rarely rises due to a large number of sellers. When an asset reaches this level, increased supply often limits price growth. A resistance level can be visualized as a ceiling that restricts the price from rising.
Support and resistance levels can be identified by analyzing historical price charts and often correspond to significant price highs and lows. However, these are not absolute levels, as prices can break through them and move higher or lower.
What are Support and Resistance Levels Used For?
Traders use support and resistance levels to determine entry and exit points for trades:
- Buying at Support: Traders may buy an asset when the price approaches a support level, anticipating a bounce upwards.
- Selling at Resistance: Traders may sell an asset when the price approaches a resistance level, expecting a downward breakout.
Key Observations:
- The more frequently a level is touched, the higher the probability of it being breached. A support level can become a resistance level and vice versa.
- Timeframes affect support and resistance levels, so traders should consider this when forming their strategies.
Support and resistance levels are best established using price charts provided by cryptocurrency exchanges or specialized platforms like TradingView. To mark these levels, lines or parallel channels (zones) are used, often with different color codes for clarity.
Methods for Determining Support and Resistance Levels:
- Chart Analysis:
The most straightforward method involves visual chart analysis. Traders identify price levels that have repeatedly served as turning points. - Technical Indicators:
Some technical indicators, like moving averages and Bollinger Bands, can help identify potential support and resistance levels. - Mathematical Methods:
Formulas like Fibonacci retracements and Gann angles are used to determine key levels. - Psychological Levels:
Rounded numbers, like $30,000 for BTC, often serve as support or resistance levels due to their psychological impact on traders.
Understanding support and resistance levels is an important element of technical analysis and can help traders make informed decisions about entering and exiting trades. However, like any other analytical tool, these levels should be used alongside other indicators and analysis methods to increase the chances of successful trading.